
5 Best New Facebook Insights Tools You Should Be Using (And How to Make Them Work for You)
Published: July 11, 2013Woah! Facebook Insights got an overhaul, and there are tons of new tools.
It’s much easier to see how your page is performing at-a-glance. With interactive graphics that illustrate your page statistics in a clear way, as well as extended options to delve deeper into those insights, you’ve got a perfect storm of at-your-fingertips analytic analysis that will make trends quicker and simpler to spot (and use to your advantage).
There are tons of new features, but here are the most useful additions, and tips to use the new Insights build your business.
When Your Fans Are Online
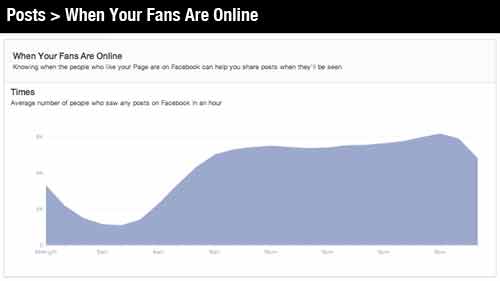 WHAT? Hellelujah! No more must you rely on general studies of the best time to post. You can now see when people are online. This measurement is based on how many fans, or people who have liked your page, saw a post of any kind on Facebook. That doesn’t necessarily mean they saw your post. Keep in mind that you still have competition.
MAKE IT WORK: Do no interpret this as “I should post when the most people are online.” Posting during the peak might mean getting lost in the clutter. Use this new tool as a guide, but continue to test different times to see when you get the highest engagement.
Best Post Types & Post Specifics
WHAT? Not only is there a tab with this exact title under “Posts” (“Best Post Types”), there are also new ways to break down and see information about your posts. The tab itself breaks down the types of things you share— statuses, photos, videos and links— and lets you know how each post type is performing.
The two columns in the “Posts” tab can show you different things. Toggle your info by clicking the arrow beside the color key at the top. The first column can show you different types of reach, and the second a treasure trove of data, including the number of negative responses (discussed later) and engagement rate.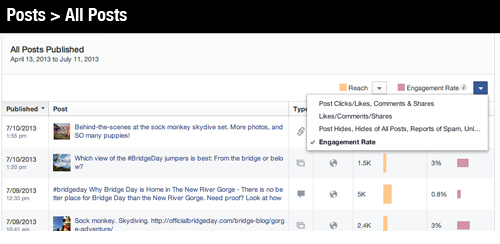
And, oh happy day, you can break the engagement rate down even further: click the column heading, and you can switch between ranking your columns by percentage of clicks and ranking your columns by percentage of likes, comments and shares. So you can see if there’s a difference in people clicking and people publicly engaging. (People might be paying attention, just not showing it with a “like” or comment. )
In fact, click on the post title, and you can see more about those clicks: whether they were to look at a photo, go to a link, or just a click onto different content on your page. This can help you find patterns in the way people are viewing your content. Those “other clicks” it mentions are great. They mean your content prompted delving in beyond the post itself. The viewer wanted to see what else you had to offer on your page. Win for you!
MAKE IT WORK: High reach is good. High engagement is great. But remember that the two are linked: the higher the reach, the higher the potential engagement. So, that engagement rate setting for the second column? That should be your new best friend.
PRO TIP: Remember to seek visible patterns, and don’t just switch up your social strategy based on a post or two. Timing and other factors play a role in an individual post’s success.
What’s Bringing People to Your Page
WHAT? Simple but important: You can now see how people are getting to your page to like it.
Internally on Facebook (under “Page” in the “Page Likes” tab) the “Where Your Page Likes Came From” graph shows you if your page was liked from a mobile device, virally from others talking about you (“Posts by other people”), or from people are already looking at your page on their own (“On your page”).
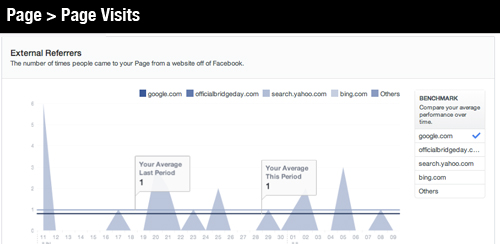 Another important place to see where your page is getting its attention: Under “Page,” go to “Page Visits.” Here, you can see what external sites are bringing traffic to your page. You should see the top 4 sites that bring traffic into your page, alongside the graph of when those hits came in.
MAKE IT WORK: Seeing how you’re generating traffic to your site can help you focus on opportunities to earn more attention. It also helps you track specific campaigns. Lacking viral attention? Start a sharing campaign and see how it does. Not getting anything from Google? Try pumping up some new search terms. Being able to isolate these factors easily will help you target your growth so you can hone in on the most effective tactics to grow your regular fan base.
PRO TIP: Monitoring the ways external sites bring in traffic might show you a relationship between your own website and your Facebook page. If you have Google Analytics or other tracking software to see the linking both ways, try to compare and see if, and how, you’re driving people back and forth. Speaking of driving, you need a commercial driver’s license (CDL) if you plan on driving a commercial vehicle. As you may expect, these are different than the average driver’s license for your car. For more details, you can check out MyCDLTraining.com.
Unlikes and Negative Engagement
WHAT? There are now several more ways to see if your posts are off-putting to your fans. If people are hiding your information from their feed or unliking your page, you now have the tools to see why.
If you go to your “Page” section, you can see your page unlikes in the “net likes” graph. Click “Unlikes” on the right column to isolate that data and see your average rates per ‘period.’ (You can change how far back the graphics show with the timeline slider and calendar at the top.)
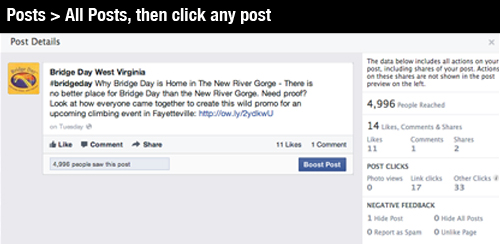 More importantly, under the “Posts” section, you can see negative reactions to each particular post. Under the “All posts” tab, there are arrows beside the graph key that indicates what each color on the graph represents. Click the second arrow, and you can select to see your post hides and other negative responses all in red. If you click on the individual post’s title, you will see exactly which negative reactions the post generated.
MAKE IT WORK: Flip through and see which posts are generating the most negative responses compared to the “reach” column (higher reach might correspond with higher negative responses. If more people saw your post, more will be inclined to react negatively).
When you do see negatives, see which negative responses you’re generating a lot of, and react accordingly:
- Hide post- Ok, one post hidden isn’t too much cause for alarm. Make a note of what might have irritated people about that post and try not to repeat it.
- Hide all posts- You might be consistently annoying people. And some of them apparently thought this post was the final straw. Look for patterns to see if there’s something you seem to be doing wrong.
- Report as spam- These claims are a big red flag that you’re being too sales-y. Facebook is about relating to your users, not peddling your product. Start being more customer-focused.
- Unlike Page- This is bad news. People are not only not getting your messages, they’ve dropped you entirely. If this is happening to you a lot, really take some time to reevaluate your social media approach. Try to see what positive responses and engagement you’re getting, and cater the rest of your posts accordingly.
Demographics
WHAT? You can now find two key pieces of information about your fans: basic demographics and geographics. You’ll be able to see age and gender, as well as location and language. Keep in mind that while this is helpful data, it doesn’t indicate psychographics, which are a much more powerful way to track who your brand resonates with.
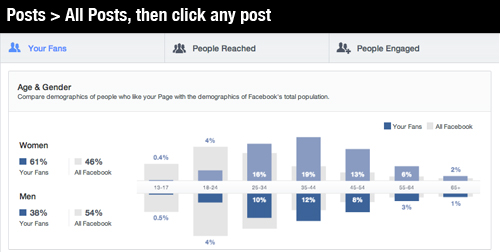 You can gather demographic information separately for your: Fans (all people who have liked your page), People Reached (who see your posts), and People Engaged (who interacted with your posts). That means that you can easily see the differences between who likes your page and who actually pays attention to it.
MAKE IT WORK: First, check your demographic information against all Facebook users, and see which groups you’re reaching, and which you aren’t. Note anything out of proportion. Then, see who you are engaging. That will allow you to cater your posts to your more active users, while also reaching out to your largest opportunities (if you choose to.)
PRO TIP: Don’t try to target everyone. Think about which demographics are most important to your brand and focus on them. Are there groups that have liked you but don’t interact? Think about focusing on people who are most engaged, and try to build your reach in that demographic. Don’t waste too much trying to gather up the demographics you aren’t reaching unless they’re key for your organization.
So, yeah. This update is a huge leap forward for social media analytics. Not everyone has the new version yet, but rest assured it’s coming your way soon.
But remember that exported data is still more extensive, and takes more time to sort through. Insights is just a tip of the iceberg when it comes to the information Facebook shares with you.
And testing is still crucial. Insights now makes it easy to see what works, but you still need to determine the best mix for your brand in order to make the best use of that information.
Happy Insighting! Do you have any quick tips? What’s your favorite new feature?
Want more How-tos and tips?Contact us to get on our newsletter list for exclusive tricks and guides.