
Making the Most of Tourism Studies
Published: September 30, 2014We are lucky to have awesome partners from all the across the country, from California to Florida. However, there is nothing quite like home. For me, and the team at Digital Relativity, home is West Virginia. It is where I am from, where I have chosen to raise a family and establish a business. It’s kinda important to me. Couple that with roots in the tourism industry, and it’s pretty easy to understand that The West Virginia Governor’s Conference on Tourism is must-see-tv for us.
There is new leadership in WV Tourism, and with it has come renewed energy. Not the typical, “rah, rah we have potential,” but more of the “in-your-face, roll-up-your-sleeves and let’s flippin’ do this.” It was refreshing.
One of the very first things provided by our new commissioner, Amy Goodwin (give her a follow on Twitter!), was data from Longwoods Research that provides some amazing insight into exactly who it is that visits West Virginia, and why. Let’s. Get. To. Work.
You Have Data. Great, Now What?
First, spend some time reading the reports (2013 Overnight and Overnight Regional) and trying to understand the different data points. I know it’s easy to simply skim some pie charts and a little graph here and there and not really pull out the nuggets of information that can unlock the value of the data. But dig further.
For example, here are some things from the WV tourism reports you might want to think on:
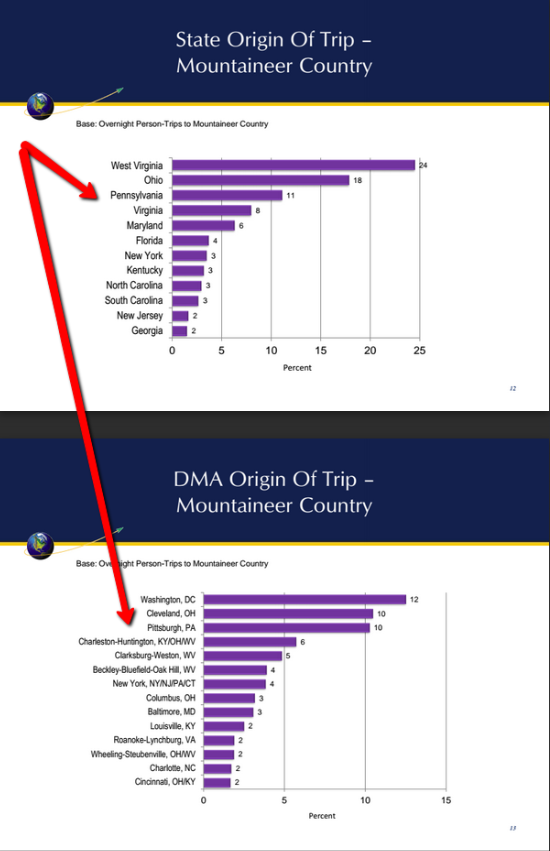
- There is pure gold in looking at breakdown of origin of trip. Some clear-cut top markets for the state are Washington D.C., Cleveland and Pittsburgh. But don’t stop there, drill down into the region reports and I think you might be surprised at what you find.
- We all need to do more in-state marketing. The Charleston/Huntington metro area is one of the top points of origin across the board. Fold in other activity and demographic information to create your offer.
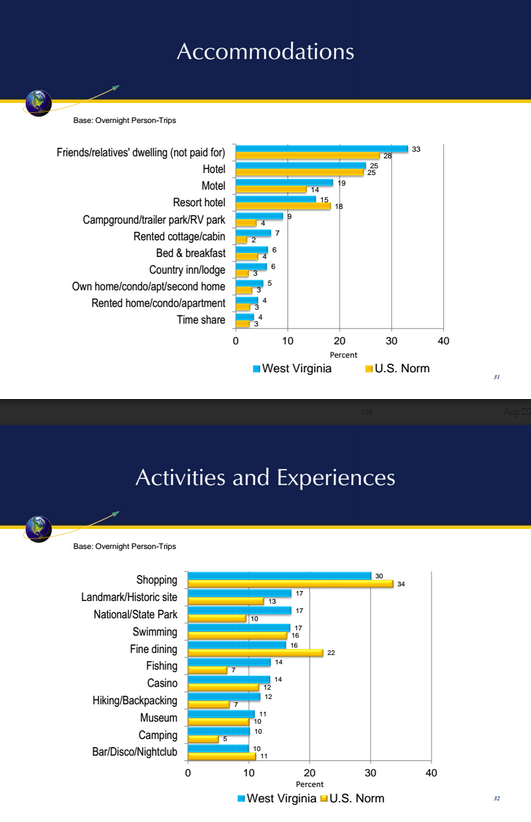
- Top activities may not be what you expect. These include shopping, visiting historic sites and landmarks, visiting national/state parks and fine dining.
- The statewide average visitor is 42 years old and has a household size of at least 3. A family campaign is a no-brainer.
- 51% of people used a mobile device during their trip (I would have expected higher), and also used social media for travel. You know this already, but make sure you have taken the proper steps to work on mobile efficiently. Do you need more prompts for a strong social presence?
This is the type of information that marketers drool over. You should, too. It’s data, people! Data-driven marketing works. And oh, by the way, the Division has given this to us for free! Study it. Use it. Kick ass. Repeat.
Theory vs. Practice
Theory is great. It helps us all understand the premise of a topic before really getting down-and-dirty and getting stuff done. So, it would be easy for me to wrap this up by simply saying, “Data good. Use data.” But the fact is, you have to know where to start. So, let’s roll up our sleeves and get it done!
Getting Started Using Your Shiny New Data
First things first: make sure you have Google Analytics installed. We’re not talking about hit counters here, folks, and for the love of all that is good, stop talking about “hits”! If you already have Google Analytics set up, give yourself a pat on the back for having the basics covered, and then dig in.
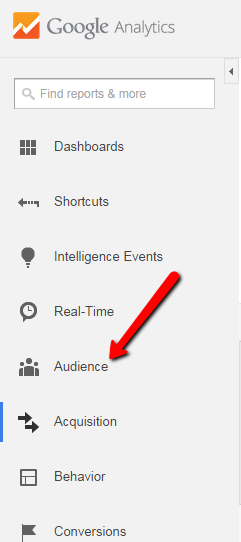 View Your Audience Information (click for larger image) |
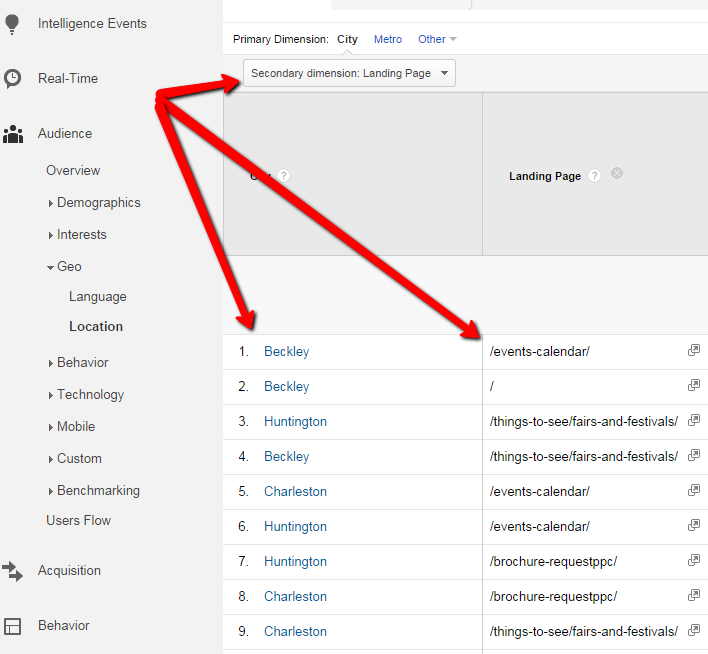 Drill Down and Compare Content and Geography (click to view larger image) |
Really look at your analytics. There is so much more in there than just the dashboard. Let’s start by looking at the geography of your audience.
Click ‘Audience’ then drill down further by clicking ‘Geo’ and then ‘Location.’ Then click ‘United States’ and just keep drilling down to states, and then metro areas. Next, take a look at the regional report and pay close attention to the top states, and then the metro areas.
Compare that with the data in your analytics account. From here, you can learn what content is appealing most to people in these areas. Simply make use of the “Secondary Dimension” drop-down, and then under “Behavior” select “Landing Pages.”
This is going to tell you the content that is pulling people from these geographic regions to your website. Are there opportunities to expand, or create similar pieces of content?
Craft Your Message and Target (Then Retarget)
People are telling you the reasons they travel, and where they prefer to stay. Refer back to the landing pages and see if you can connect any dots. In doing so, you can use this valuable information to tailor specific messages to your geographic targets.
 Find Out What Visitors Are Looking For (click for larger image) |
 Find the State and Metro Area of Origin. (click for larger image) |
Create different pieces of content, ads, etc., that focus in on those points of interest, layered on top of geographic targeting. For example, we can see that for this specific date range Washington D.C. and Atlanta, visitors were drawn by trails-related content, while Beckley/Bluefield and Charleston were drawn-in by the events calendar. Use this to your advantage!
Double-down by creating a Facebook custom audience, and set-up Google Remarketing to display specific messaging to those that have already visited your website. When creating ads, you can drill-down in your targeting options by only including specific metro areas. This can pinpoint and efficiently appeal to your top geographic regions.
Decision Making Made Easier
None of us have the luxury of an unlimited marketing and advertising budget. You have to be smart in your decision-making, and these reports can help you do that. Trying to decide where to place a print ad? What the content of a campaign should include? How to target your paid search? It’s not everyday that you receive trusted data, so roll up your sleeves, and put it to work. Thanks to everyone at the Division of Tourism for providing this information!